Aerial surveys / Industry
Geotechnical
- Who it's for
- Geotechnical and civil engineers, contractors and site managers
- Detail
- About 2.2 cm per pixel on a sea cliff scan
- Delivered as
- Files for QGIS or QField
What you get
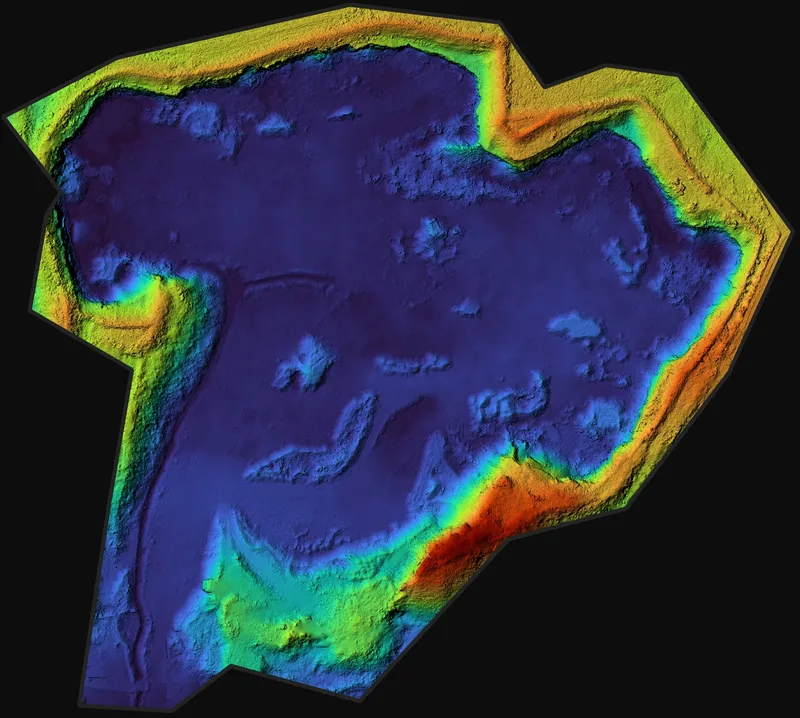 Terrain and surface modelsThe bare ground, or everything on it, kept up to date between visits.
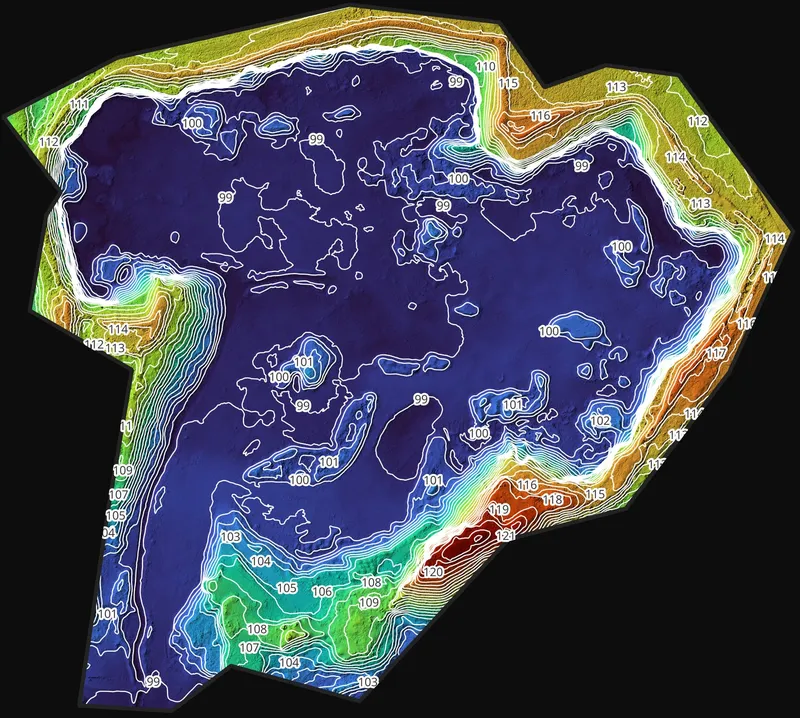 Contours and cross-sectionsFor design, earthworks and slope checks.
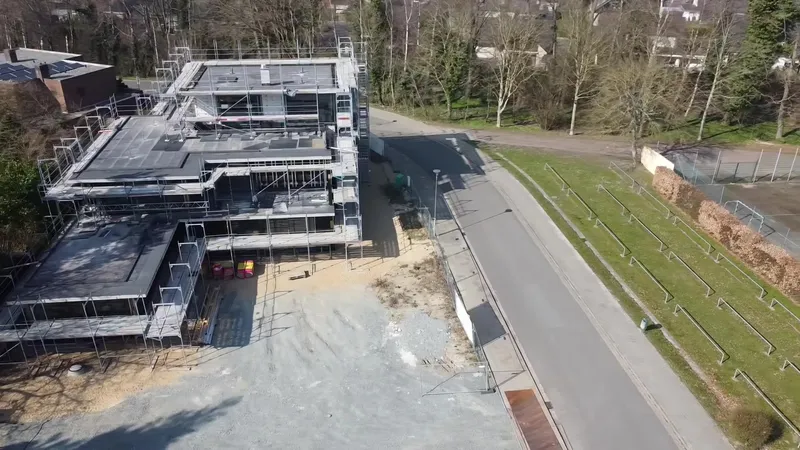 Cut and fill volumesHow much ground has moved, and where.
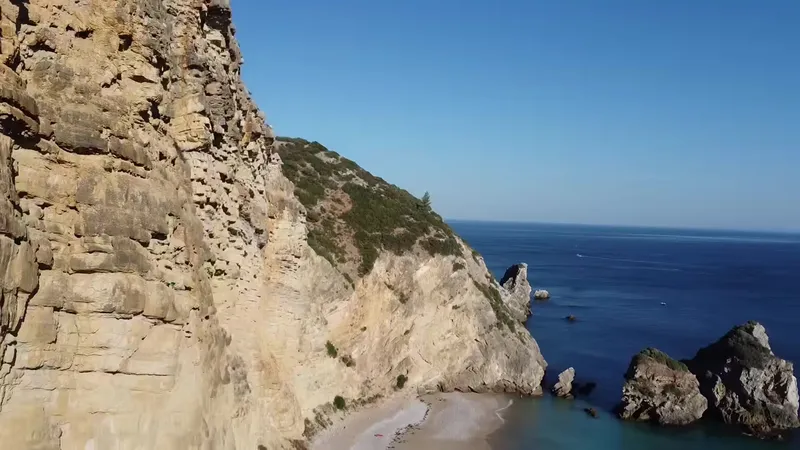 3D models of slopes and cliffsDetailed models of rock faces you can’t safely reach.
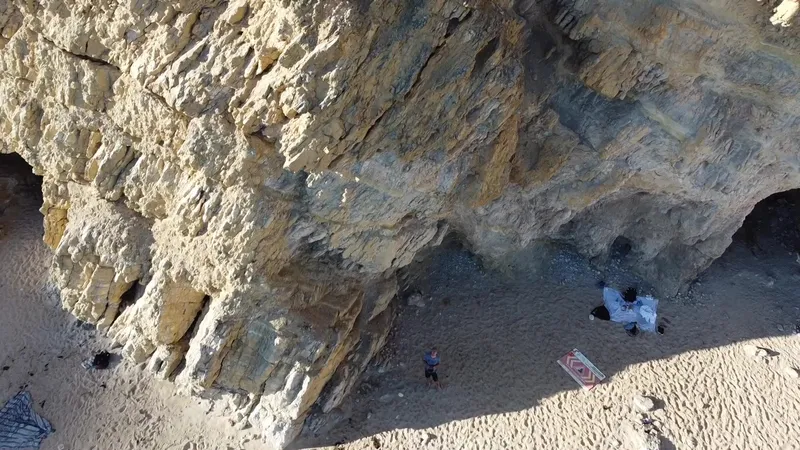 Structural dataBedding, faults and fractures, measured and listed in a table.
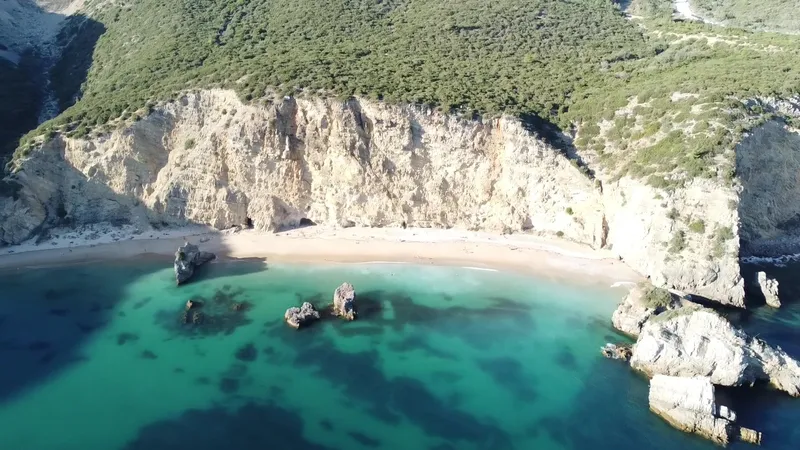 Rockfall risk mapsWhere rock is most likely to fall.
How rockfall mapping works
- ScanA LiDAR scan of the cliff or rock face.
- ModelA detailed 3D model of the rock.
- FindSoftware finds the exposed rock surfaces and groups them into sets.
- TraceWe trace bedding, faults and fractures by hand.
- MapA rockfall risk map, and a table of every feature.
Sea cliffs in southern Portugal
Near Lagos, on Portugal's south coast, we scanned a sea cliff with LiDAR at about 2.2 cm per pixel. The bedding and fractures showed clearly. Higher resolution is possible in good flying conditions.
Pair the survey with our QGIS training for geotechnical engineering, so your team can work with the models themselves.
Ask for a quote: mail@geoklein.com